


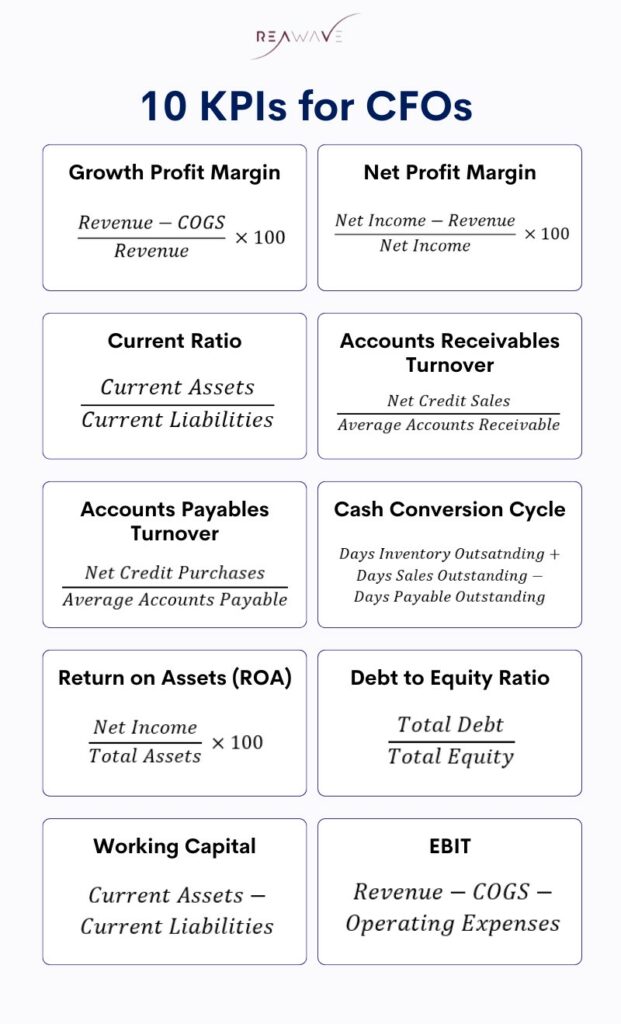
In today’s dynamic financial landscape, Chief Financial Officers (CFOs) are expected to go beyond traditional reporting and play a strategic role in guiding business decisions. Monitoring the right key performance indicators helps track financial health, optimize operations, and drive sustainable growth.
This blog outlines 10 Key Performance Indicators for CFO to track, understand, and use to make informed decisions. Whether you’re leading a multinational finance team or managing the books of a growing startup, these KPI accounting and finance metrics are foundational.
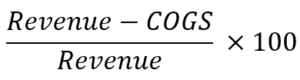
1. Gross Profit Margin
What it measures:
The percentage of revenue left after accounting for the cost of goods sold (COGS). It indicates how efficiently a company produces its goods or services.
Formula:
Why it matters:
A strong gross profit margin means the company is keeping production costs in check and pricing its offerings effectively. CFOs use this to identify if changes in raw materials, labor, or overheads are affecting profitability. It also supports strategic pricing, product line evaluation, and forecasting.
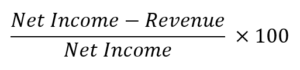
2. Net Profit Margin
What it measures:
The percentage of revenue remaining after all expenses—operating costs, taxes, interest, and other deductions—have been subtracted.
Formula:
Why it matters:
This KPI shows how much actual profit a company generates from its revenues. A declining net profit margin signals rising costs or inefficiencies. It helps CFOs assess financial sustainability, support investor relations, and benchmark against competitors.
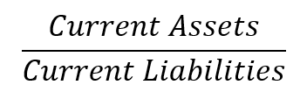
3. Current Ratio
What it measures:
A liquidity metric that evaluates a company’s ability to meet its short-term liabilities with its short-term assets.
Formula:
Why it matters:
CFOs use this to assess the company’s ability to stay solvent in the near term. A ratio too low could indicate potential cash flow issues, while a very high ratio might signal underutilized assets. It’s essential for maintaining operational resilience and reassuring stakeholders.
4. Accounts Receivable Turnover
What it measures:
How efficiently a company collects payments from its customers over a specific period.
Formula:
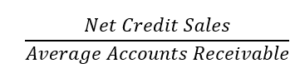
Why it matters:
This KPI impacts cash flow and working capital. A high turnover means faster collection and stronger liquidity, while a low rate could suggest weak credit control or customer payment issues. CFOs monitor this to optimize credit policies and reduce bad debt risks.
5. Accounts Payable Turnover
What it measures:
Accounts Payable Turnover helps measure how quickly a company pays its suppliers and vendors.
Formula:
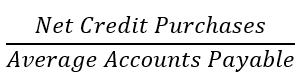
Why it matters:
This KPI reflects how well the company manages its cash outflows and vendor relationships. Faster payments can build supplier trust, but may strain cash reserves. CFOs aim for a healthy balance to support supply chain continuity while optimizing liquidity.
6. Cash Conversion Cycle (CCC)
What it measures:
The number of days it takes to convert investments in inventory and other resources into cash flows from sales.
Formula:
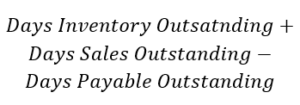
Why it matters:
A shorter CCC indicates better cash management and operational efficiency. CFOs use it to pinpoint inefficiencies in inventory, sales, or payables. It’s especially vital in industries with high inventory costs or tight margins.
7. Return on Assets (ROA)
What it measures:
Return on Assets help measure how effectively a company uses its assets to generate profit.
Formula:
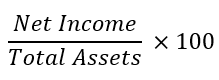
Why it matters:
ROA reflects how well the company is deploying its resources. A higher ROA means better asset utilization. CFOs track this to evaluate capital investments and operational performance, guiding decisions on future acquisitions or asset allocation.
8. Debt-to-Equity Ratio
What it measures:
Debt to equity ratio measures the proportion of company financing that comes from debt versus shareholders’ equity.
Formula:
Why it matters:
This KPI is central to understanding financial leverage and risk. A high ratio may indicate aggressive borrowing, raising red flags for lenders and investors. CFOs use this to manage funding strategies and ensure long-term financial stability.
9. Working Capital
What it measures:
The difference between current assets and current liabilities, reflecting the liquidity available for daily operations.
Formula:
Why it matters:
Positive working capital means a company can cover its short-term obligations and invest in growth. CFOs rely on this KPI for budgeting, supply chain planning, and cash flow management. Negative working capital, if persistent, can be a serious red flag.
10. Earnings Before Interest and Taxes (EBIT)
What it measures:
EBIT measures the company’s profit from core operations before considering interest and tax expenses.
Formula:
Why it matters:
EBIT strips away non-operational factors, giving CFOs a clear view of operational profitability. It’s crucial for comparing performance across periods or competitors and is often used in valuation, M&A, and strategic decision-making.
Tracking the right key performance indicators for CFOs is more than a reporting requirement, it’s a strategic necessity. These KPIs give CFOs the insights needed to manage risks, streamline operations, and guide company growth. Whether you’re developing a financial dashboard or evaluating quarterly reports, these accounting KPI metrics are essential tools in every CFO’s toolkit.
By consistently monitoring these indicators, CFOs can align finance with business strategy, ensure regulatory compliance, and create long-term value for shareholders. These aren’t just numbers, they are the compass for your financial leadership.